Deep Value Investing
Développeur Higher Order Investing, inc.
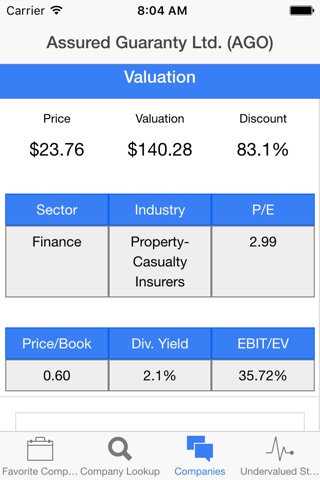
Deep Value Finder provides lists of the best American stock investment values, convenient access to key company fundamentals and unique tools for tracking both the business and market performance of your stock investments.
Dont waste time guessing what investments are best by looking at price charts. Studies have conclusively shown that the best returns come from a diversified portfolio of stocks that are cheap according to common metrics like EBIT/EV and P/E. Deep Value Finder provides lists of the best stock values according to these metrics, an intrinsic value based on projected discounted cash flow and a convenient reference to the core fundamentals for all companies. Our portfolio tracking can be just a list of stocks or, if you enter share counts, we show your portion of the companies profits, revenue, assets and dividends. All tracking is private and local to your device.
More details:
Deep Value Finder lists the cheapest stocks according to:
--Intrinsic value estimated with our discounted cash flow projections (this is our favorite and only available from our site and app)
--Highest Assets to Price
--Lowest Price / Earnings
--Highest EBIT/EV (the best technique according to some researchers.)
--Highest Dividend Yield
We also provide easy access to the most important company fundamentals. If you hear about an interesting company, you can understand its financial performance and position much faster using Deep Value Finder than trying to read one of the big finance web pages from your phone or tablet or waiting until you are back in front of a computer.
Fundamentals available include
-Five years worth of annual data and 15 months of quarterly data for most companies (three and nine in portrait).
-Per share and total values.
-Income values such as revenue, interest expense, operating income, pre-tax income, net income, and depreciation.
-Cash flow values such as owner earnings (free cash flow), capital expense, dividends and retained earnings.
-Balance sheet values such as assets, net assets, outstanding and diluted shares, current assets, cash, inventory, property, goodwill, intangible assets, long-term debt and total liabilities.
-Key ratios such as return on equity, return on tangible equity, return on assets, return on sales and debt to equity.
We also include the last closing price and the percentage by which we think the company is discounted or overpriced by the market. At the same time we provide the "look-through" analysis described by Warren Buffett, showing key performance measures for your portion of each company of your investment portfolio. For example, if you have 115 shares of IBM, Deep Value Finder will show that in fiscal 2015 your investment had $3,092 of revenue, $452 of net income and paid $188 in dividends. No other app provides this invaluable information to help you value your investment portfolio as a business, like Mr. Buffett recommends.
We love hearing from our customers, so feel free to contact us anytime from www.higherorderinvesting.com


